Visual Graph Explorer
Overview
As its name suggests, the Visual Graph Explorer makes it simple to explore the many hundreds of thousands of information nodes and connections that currently exist within CovidGraph. Before starting it is worth having a look at the simplified Data Model of CovidGraph. This will provide useful context and can serve as a navigation aid on your travels through CovidGraph.
[Data Model Diagram]
The Interface
The Visual Graph Explorer Interface is simple and consists of three main panels:
- the search panel
- the results panel
- the detail panel.
Although simple, this interface is a sophisticated tool that can be used to run simple, direct queries against CovidGraph but the real power of the Visual Graph Explorer lies in the limitless ability to keep following and loading more connections and related nodes into the results panel.
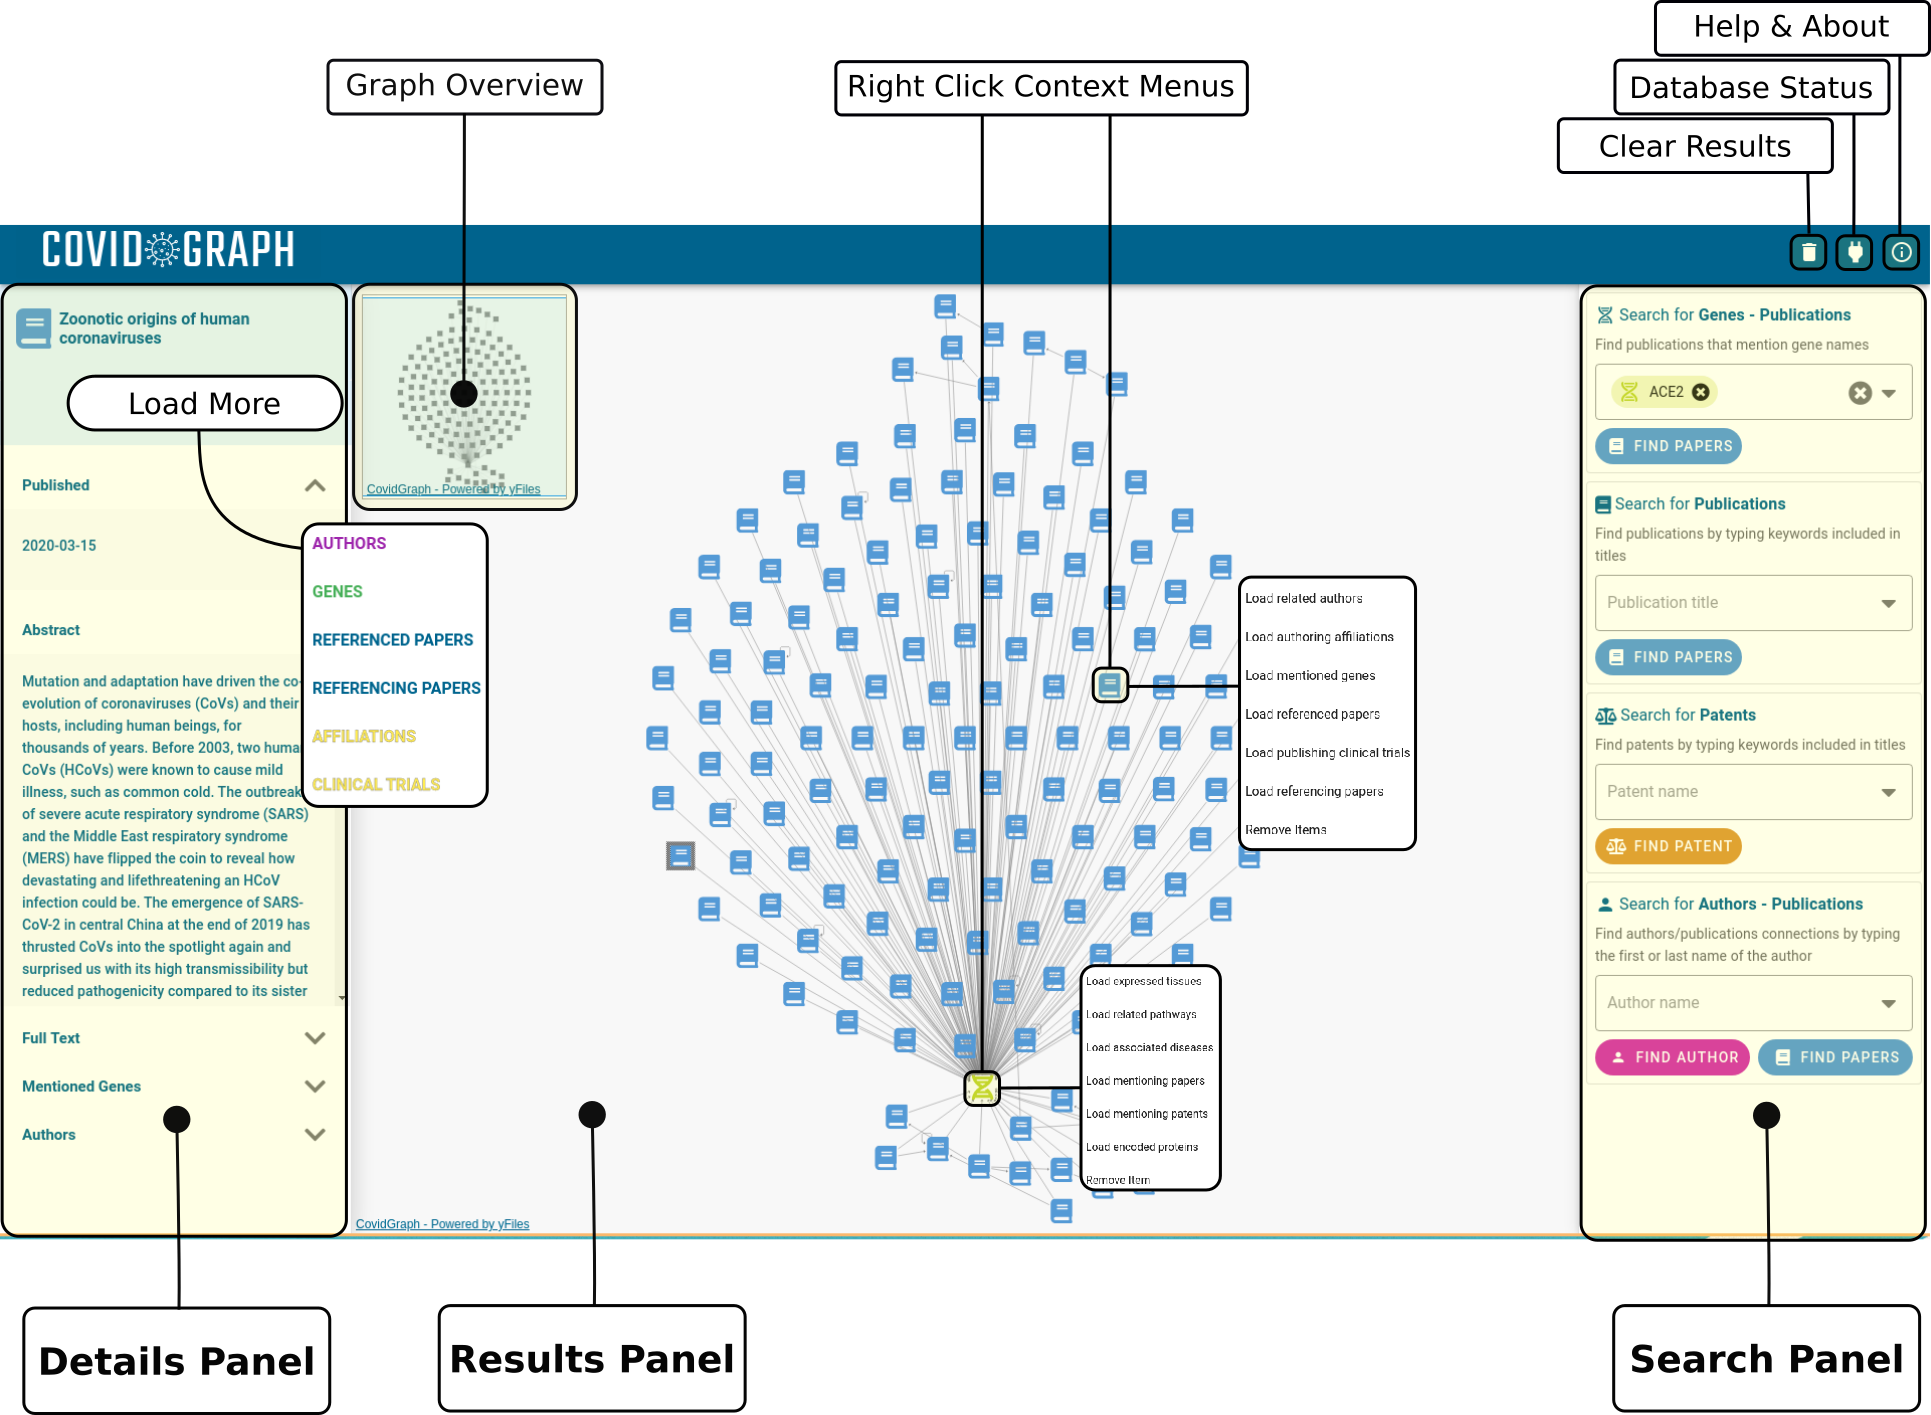
The Search Panel
The search panel has four options which allow for specific node types to be chosen as an initial starting point.
- Genes - Publications: This will load one or more genes along with any publications that mention them.
- Publications: This will load a single publication into the results panel for use as a starting point for loading more related nodes.
- Patents: This will load a single patent into the results panel for use as a starting point for loading more related nodes.
- Authors - Publications: It is possible to load either the Author as a single node, or all the papers by an author into the results panel.
The Results Panel
The Results Panel is a blank canvas to which search results and additional nodes are loaded. Until the results panel is cleared any new queries and results are continually added into the same view. Often, new results will have connections to nodes already in the Results Panel and these will be shown as new connected nodes. Sometimes, however, no connections exist and the results are added as a new cluster.
Navigating the Results Panel
The Visual Graph Explorer will automatically control the layout of the results and will update the layout each time more nodes are loaded. Where a large number of nodes are returned it is possible to zoom in or out by using the mouse scroll button while the cursor is hovering over the results panel. It is also possible to shift the entire results panel by left clicking and dragging the mouse in any direction. This is useful when zoomed into the results and the Graph Overview helps to orient the active window.
Search for More Nodes.
Because the results panel is not cleared automatically when a new search is run any new results will be added to the Results Panel. This behaviour is by design and allows for more complex exploration of CovidGraph. For example two specific publications can be loaded into the Results Panel. Loading nodes (e.g genes) related to either of these papers will reveal any nodes that the two papers have in common. This approach is not limited to two nodes but can be applied to any number of nodes.
Right Click Context Menus
It is possible to right click on any node in the Results Panel and depending on the type of node it will be possible to load more related nodes. For example, by right clicking on a publication it is possible to 'Load Related Authors'. The options available will vary by the type of node that has been right clicked. This is perhaps, the easiest way to follow and load connected nodes in the Visual Graph Explorer and there is no limit to number of times, or the variety of related nodes that can be loaded into the Results Panel. Consequently, queries that would be complex to write are trivial to create in the Visual Graph Explorer.
Removing a Node
To fine tune a search or to remove unnecessary nodes that may be cluttering up the Results Panel, right click the node to be removed and select 'Remove Item'. This will remove the Node and all of its connections from the current view.
Clearing the Results panel
To completely clear the Results Panel simply click the 'Clear the Graph' bin icon at the top right of the screen. This will clear everything from the Results Panel leaving a fresh, blank canvas.
The Detail Panel
The detail panel will display details like a description or abstract for the most recently selected node. The panel is context sensitive and will load section headings and details that are relevant to the selected node type.
The Detail Panel offers another route to load related nodes into the Results Panel. At the top of the panel, a 'Load More' button, where related nodes exist, will appear. This will show a list of node types that may be related to the currently selected node. This is also context sensitive and will vary by node type. For example if a gene is selected the 'Load More' menu will include, amongst others, 'Tissues Expressed', 'Related Pathways' where a Publication node will include 'Related Authors' and 'Related Affiliations'